




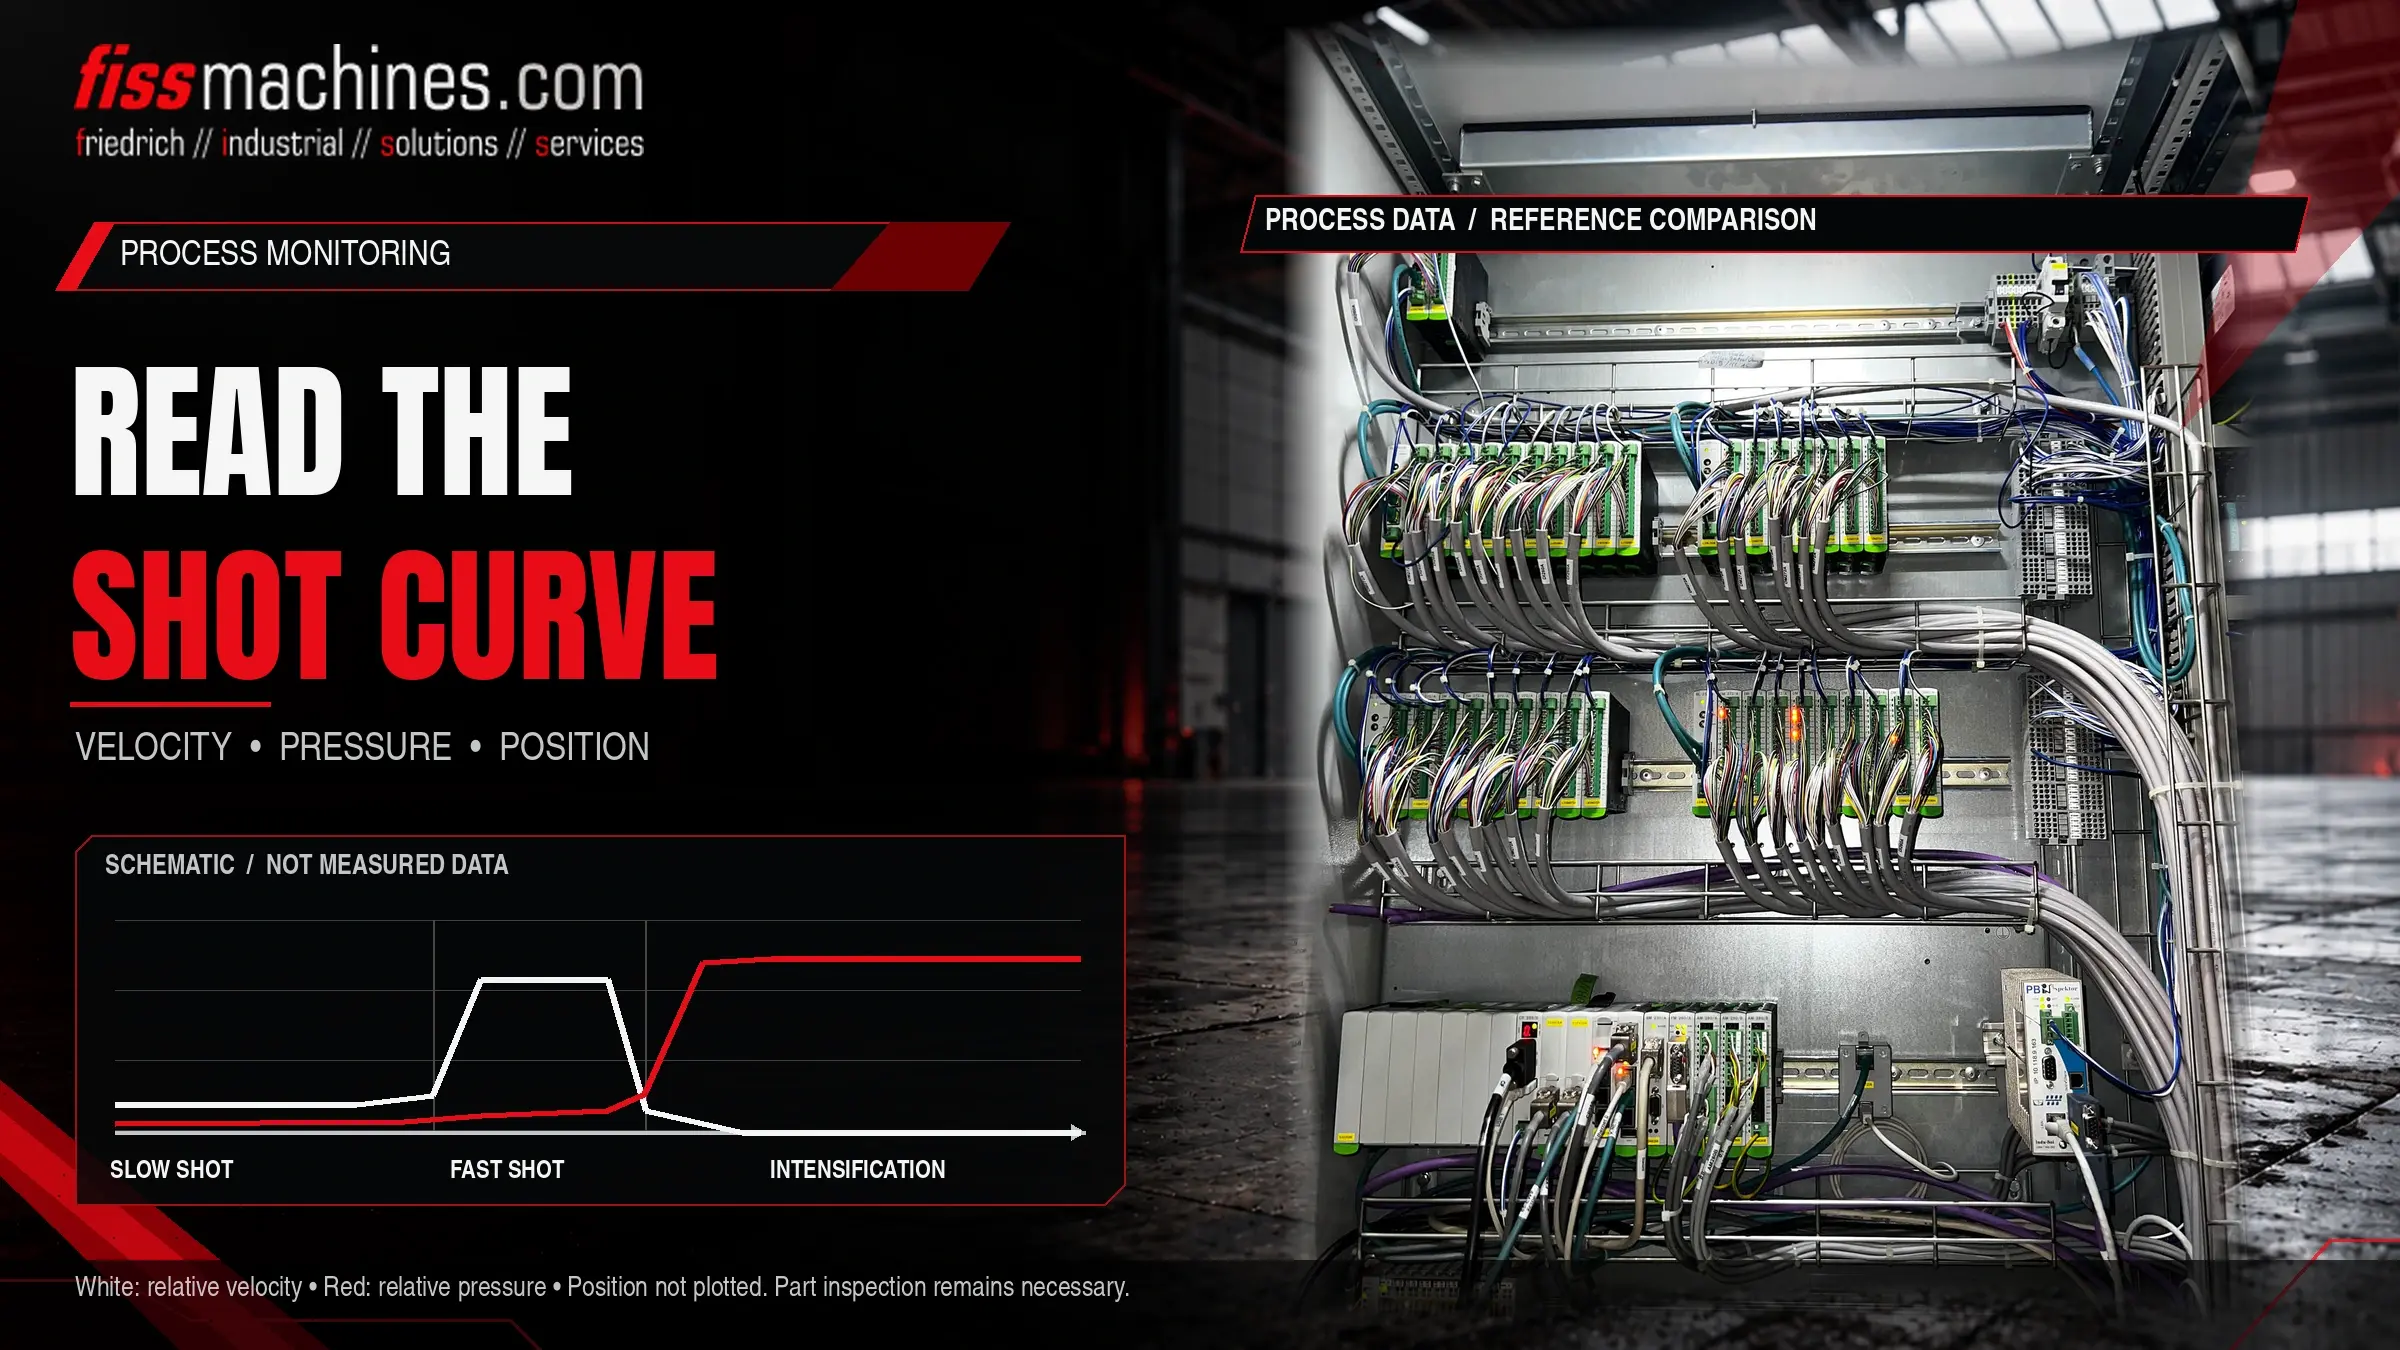
Understanding Shot Curves: Process Monitoring in Die Casting
Every shot on a modern die casting machine leaves a trace: plunger position, plunger speed and hydraulic pressure recorded over a few fractions of a second. Read correctly, these shot curves show whether the machine repeated the intended sequence, where it drifted and which component may be responsible. They are one of the most useful diagnostic tools in the foundry, provided the data is reliable and the people reading it know what normal looks like.
What Does a Shot Curve Tell You?
A shot curve plots plunger travel, plunger velocity and pressure against time or stroke for a single shot. Compared with a known good reference shot, it reveals deviations in the slow phase, the switch-over to fast shot, the fast-shot velocity, the pressure build-up during intensification and the final plunger position.
A curve does not prove that a casting is good. It shows whether the machine behaved as intended; whether that behaviour produces sound parts still has to be confirmed by inspection of the castings.
Which Signals Make Up a Shot Curve?
The exact set of channels depends on the machine and its control, but most systems record a similar core. Some values are measured directly, others are calculated. Knowing which is which matters when a curve looks strange.
| Signal | Source | What it shows | Limitation |
|---|---|---|---|
| Plunger position | Linear position transducer on the shot cylinder | Stroke over time, switch-over point, final position | Mounting and calibration must be correct |
| Plunger velocity | Usually derived from the position signal | Slow-shot profile, fast-shot speed, deceleration | Sensitive to sampling rate and filtering |
| Hydraulic pressure | Pressure transducers on the shot cylinder (piston and rod side) | Resistance during filling, intensification build-up | Sensor response and position on the circuit affect the trace |
| Metal pressure | Calculated from hydraulic pressures and area ratios | Approximate pressure acting on the metal | Calculated value; friction and dynamic losses are not included |
| Accumulator pressure | Transducer on the accumulator circuit, where fitted | Energy available for fast shot and intensification | Not recorded on every machine |
Many cells also store single values per shot alongside the curves, such as fast-shot velocity, switch-over position, intensification rise time, final plunger position and cycle time. These values make trends visible over hundreds of shots without opening each curve.
Reading a Shot Curve Step by Step
The physics of the filling phases, including why the slow shot must push air ahead of the metal and why venting and vacuum matter, is explained in our article on mold filling and vacuum. Here the focus is on what to look for in the recorded data.
Start position and slow phase
Check that the plunger starts from the same position and accelerates smoothly. An uneven velocity line in the slow phase can point to valve behaviour, friction in the sleeve or a varying pour volume.
Switch-over to fast shot
Compare the stroke position where velocity rises sharply with the set value. A shifted switch-over changes how much metal is already in the gating system when the fast phase begins.
Fast-shot velocity and braking
Look at the level, the stability and the end of the fast phase. Spikes at the end of filling are often linked to the braking behaviour of the shot end and can stress die and machine.
Intensification and final position
Assess how quickly pressure rises once the cavity is full and whether it stays stable. The final plunger position indicates the biscuit length and therefore how consistent dosing was.
Typical Deviations and Possible Causes
The table below lists frequent patterns. The causes are possibilities to investigate, not automatic diagnoses; several can apply at the same time, and the same pattern can have different origins on different machines.
| Pattern | Possible causes | First checks |
|---|---|---|
| Final position scatters shot to shot | Inconsistent dosing, metal solidifying in the sleeve | Dosing system, ladle or furnace, sleeve temperature |
| Fast-shot velocity lower than set | Low accumulator charge, valve response, increased friction | Accumulator pressure and pre-charge, valves, plunger and sleeve wear |
| Slow intensification rise | Multiplier or valve issues, internal leakage, gas pre-charge | Intensifier circuit, seals, accumulator condition |
| Pressure decays during dwell | Internal leakage, metal flashing at the parting line | Cylinder seals, check valves, die locking and parting line |
| Noisy or jagged velocity trace | Sensor or wiring problems, aggressive filtering settings, sticking plunger | Transducer, cabling, data settings, plunger lubrication |
Before changing process settings because of an odd curve, confirm that the sensor, its mounting and the recording settings are correct. A loose transducer can mimic a mechanical fault convincingly.
Building a Practical Monitoring Strategy
Reference shots and tolerance bands
Monitoring starts with a defined reference: curves and single values from a stable run that produced parts released by quality inspection. Tolerance bands around the key values allow the cell to flag deviating shots automatically. Bands that are too tight produce false alarms and are soon ignored; bands that are too wide let real drift pass unnoticed.
Linking shot data to parts
The value of shot data rises sharply when each shot can be linked to the casting it produced, for example through a shot counter or part marking. Deviating shots can then be sorted out, and inspection results can be correlated with process data over time. How sorting gates, marking and handling fit into a cell is covered in our article on automation in the die casting cell.
Monitoring versus closed-loop control
Recording curves is not the same as controlling them. Many machines run the shot with set valve positions and record the result; others adjust the shot in real time during each stroke. Both can be monitored, but the expected scatter and the meaning of a deviation differ.
Shot Curves When Assessing a Used Machine
Stored curves from production can be valuable evidence of how the shot end behaved before a machine was shut down. When they are available, ask for curves from different periods, not just one example. If they are not, a test run under supervision, where safely possible, allows curves to be recorded on site. Older machines may not have a shot monitoring system at all; in that case retrofitting one is often possible, but sensors, control integration and the effort involved should be assessed in advance.
Checklist for Reliable Shot Monitoring
- Position and pressure transducers identified, mounted securely and calibrated
- Clear which channels are measured and which are calculated
- Sampling rate and filtering documented and kept constant
- Reference shots defined from a run with released parts
- Tolerance bands set for key single values and reviewed periodically
- Shot data linked to parts or at least to time and shot counter
- Accumulator pressures and pre-charge included in maintenance routines
- Responsibilities defined: who reviews alarms and who may change settings
- Curve changes after maintenance compared with the previous reference
Frequently Asked Questions
Is the metal pressure on the curve the real pressure in the cavity?
Usually not exactly. It is typically calculated from hydraulic pressures and cylinder areas, so friction and dynamic effects are not included, and pressure in the cavity also depends on gating and solidification. Treat it as a comparison value between shots.
Can shot curves replace X-ray or other part inspection?
No. They show whether the machine repeated its sequence. Porosity or other defects can also come from the die, the melt or die temperature, which a shot curve does not capture.
How often should reference curves be updated?
Whenever the die, the shot sleeve, the plunger or relevant settings change, and after major maintenance. Keep the old reference so that changes remain traceable.
Can an older machine be fitted with shot monitoring?
In many cases, yes, using retrofit sensors and a separate recording system or an updated control. Feasibility depends on the hydraulic design, mounting space and how the data is to be used.
FISS Supports Machine Assessment and Service.
Whether you are reviewing the shot end of a used cold chamber machine or planning an inspection of your own equipment, FISS can discuss the available data and the next technical steps with you.
